Semantic Sholar
-
00:00
1.
Microsoft Excel: Plotting Multiple Data Series in Excel
- 索引
- 筆記
- 討論
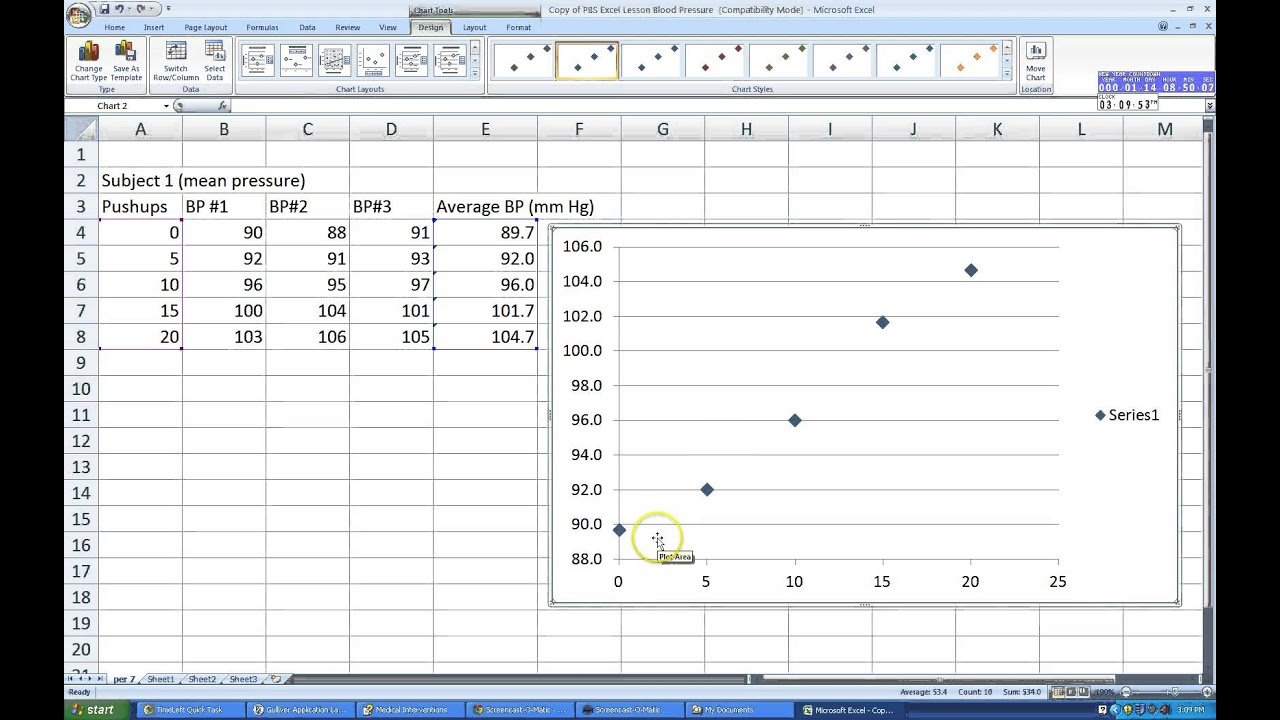
Microsoft Excel: Plotting Multiple Data Series in Excel
長度: 12:53, 瀏覽: 903, 最近修訂: 2019-07-26
播放影片: http://llai.cm.ntu.edu.tw/media/797
This video shows how to: 1. Use the average function in excel 2. Plot a scatter plot 3. Plot a best fit line 4. Add multiple data series to a graph
- 位置
-
- 資料夾名稱
- 研究基本功
- 發表人
- 賴亮全
- 單位
- 賴亮全教授
- 建立
- 2019-07-26 15:39:33
- 最近修訂
- 2019-07-26 15:39:34
- 長度
- 12:53
- 來源
- https://www.youtube.com/watch?v=DMlfxsNdaNc