Comparative Gene-Expression Analysis I: Hybridization-based techniques
-
00:00
1.
index 1
-
00:25
2.
Question
-
00:44
3.
Sample Acquisition and Nucleic Acid Extraction
-
04:12
4.
QuestionThere were 50 µL RNA samples. You added 2 µL RNA sample to 78 µL sterile water and measured the optical density of your sample at a UV wavelength of 260 nm. If the absorbance reading was 0.08, what was the initial amount of your RNA sample?6.4 µg
-
05:50
5.
Methods to Check NA Quality1
-
07:58
6.
QuestionWhen you check the integrity of mRNA, why do you check the integrity of ribosomal RNA (28S and 18S rRNA)?
-
08:25
7.
Methods to Check NA Quality2
-
10:26
8.
RIN-RNA Integrity Number
-
13:16
9.
Methods to Check NA Quality3
-
16:45
10.
Methods to Check RNA Quality4
-
18:02
11.
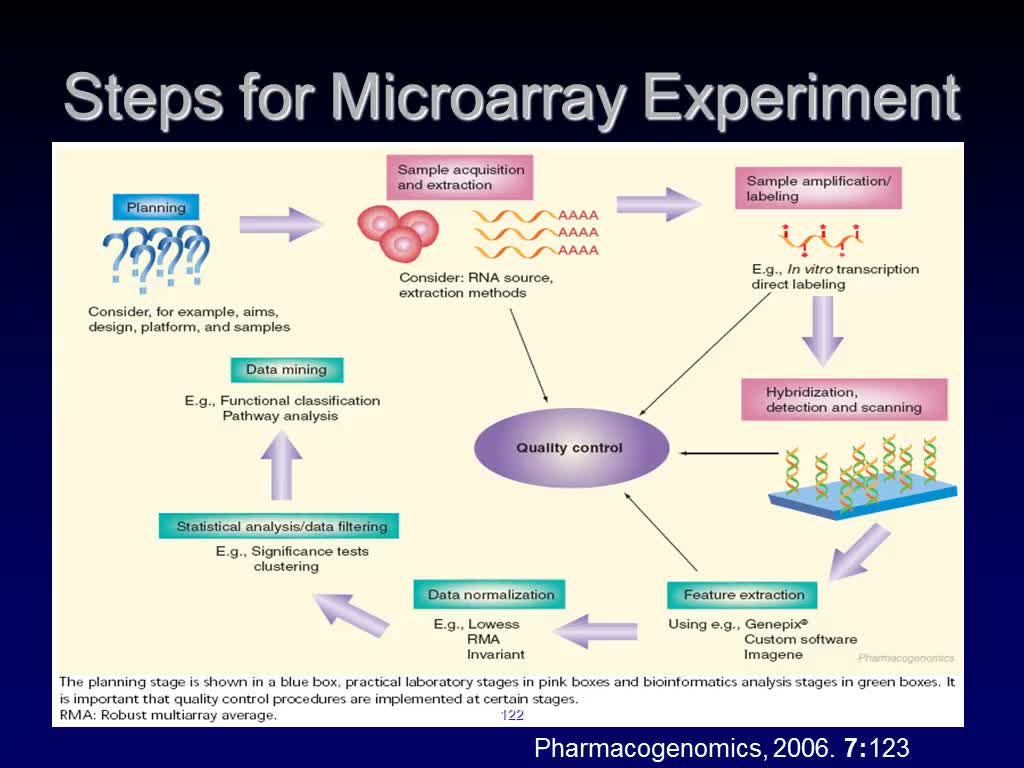
Steps for Microarray Experiment
-
18:40
12.
Sample Amplification / Labeling
-
18:50
13.
In Vitro Transcription
-
19:49
14.
Steps for Microarray Experiment
-
20:08
15.
Hybridization & Scanning
-
20:24
16.
Steps for Microarray Experiment
-
21:18
17.
Visual inspection of array features
-
23:01
18.
Box plots consist of boxes with a central line and two tailsCentral line: median of the dataUpper (seventy-fifth percentile, Q3) and lower quartile (twenty-fifth percentile, Q1) Ends of the whiskers:1.5x IQR (interquartile range) Max or min value within 1
-
25:50
19.
Examples of Bad Slide Quality
-
27:30
20.
QuestionWhat are the advantages of using Illumina bead arrays?
-
28:47
21.
Steps for Microarray Experiment
-
30:09
22.
Normalization1
-
33:14
23.
Normalization2
-
36:02
24.
Normalization3
-
40:22
25.
Single Channel Normalization and Scaling
-
41:38
26.
Summarization
-
43:12
27.
Visualization Tools for Microarray Analysis
-
44:38
28.
Heat Map and Dendrogram
-
46:09
29.
Violin Plot
-
47:20
30.
Scatter Plot
-
49:30
31.
MA Plot
-
49:53
32.
Volcano plot
-
54:27
33.
Bar Chart
-
58:16
34.
Line Graph
-
1:00:53
35.
Pie Chart
-
1:01:51
36.
Venn Diagram
-
1:03:07
37.
Starburst Plot
-
1:03:59
38.
Visualization of Gene Distribution
-
1:06:46
39.
Visualization of Gene Distribution
-
1:10:06
40.
PCA and MDS
-
1:12:35
41.
MDS (Multidimensional Scaling)Principal Coordinate Analysis (PCoA)
-
1:15:11
42.
Correspondence Analysis (CA)
-
1:15:33
43.
QuestionIf you want to check data quality of microarray experiments, which graph will not be used? Scatter plot of PCAHeat mapBox plotVenn diagram
-
1:16:28
44.
Steps for Microarray Experiment
-
1:16:37
45.
Precision vs Accuracy
-
1:20:04
46.
Confusion Matrix (混淆矩陣)
-
1:26:33
47.
Sensitivity vs Specificity
-
1:27:45
48.
Positive Predictive Value (PPV) vs Negative Predictive Value (NPV)
-
1:28:53
49.
Precision (PPV) vs Recall (Sensitivity)
-
1:29:25
50.
Accuracy Paradox
-
1:31:53
51.
F1 Score
-
1:33:23
52.
Alpha vs Beta value
-
1:34:50
53.
Power as a Function of Alpha and Sample Size
-
1:37:32
54.
Sample Size Calculation
-
1:38:41
55.
How to Decide the Cutpoint?
-
1:39:44
56.
Contradiction Between Sensitivity & Specificity
-
1:42:59
57.
Receiver Operating CharacteristicCurve
-
1:45:06
58.
Receiver Operating CharacteristicCurve
-
1:45:41
59.
Summary of Statistics
- 索引
- 筆記
- 討論
- 全螢幕
Comparative Gene-Expression Analysis I: Hybridization-based techniques (0309)
長度: 1:47:36, 瀏覽: 906, 最近修訂: 2021-03-10
-
00:00
1.
index 1
-
00:25
2.
Question
-
00:44
3.
Sample Acquisition and Nucleic Acid Extraction
-
04:12
4.
QuestionThere were 50 µL RNA samples. You added 2 µL RNA sample to 78 µL sterile water and measured the optical density of your sample at a UV wavelength of 260 nm. If the absorbance reading was 0.08, what was the initial amount of your RNA sample?6.4 µg
-
05:50
5.
Methods to Check NA Quality1
-
07:58
6.
QuestionWhen you check the integrity of mRNA, why do you check the integrity of ribosomal RNA (28S and 18S rRNA)?
-
08:25
7.
Methods to Check NA Quality2
-
10:26
8.
RIN-RNA Integrity Number
-
13:16
9.
Methods to Check NA Quality3
-
16:45
10.
Methods to Check RNA Quality4
-
18:02
11.
Steps for Microarray Experiment
-
18:40
12.
Sample Amplification / Labeling
-
18:50
13.
In Vitro Transcription
-
19:49
14.
Steps for Microarray Experiment
-
20:08
15.
Hybridization & Scanning
-
20:24
16.
Steps for Microarray Experiment
-
21:18
17.
Visual inspection of array features
-
23:01
18.
Box plots consist of boxes with a central line and two tailsCentral line: median of the dataUpper (seventy-fifth percentile, Q3) and lower quartile (twenty-fifth percentile, Q1) Ends of the whiskers:1.5x IQR (interquartile range) Max or min value within 1
-
25:50
19.
Examples of Bad Slide Quality
-
27:30
20.
QuestionWhat are the advantages of using Illumina bead arrays?
-
28:47
21.
Steps for Microarray Experiment
-
30:09
22.
Normalization1
-
33:14
23.
Normalization2
-
36:02
24.
Normalization3
-
40:22
25.
Single Channel Normalization and Scaling
-
41:38
26.
Summarization
-
43:12
27.
Visualization Tools for Microarray Analysis
-
44:38
28.
Heat Map and Dendrogram
-
46:09
29.
Violin Plot
-
47:20
30.
Scatter Plot
-
49:30
31.
MA Plot
-
49:53
32.
Volcano plot
-
54:27
33.
Bar Chart
-
58:16
34.
Line Graph
-
1:00:53
35.
Pie Chart
-
1:01:51
36.
Venn Diagram
-
1:03:07
37.
Starburst Plot
-
1:03:59
38.
Visualization of Gene Distribution
-
1:06:46
39.
Visualization of Gene Distribution
-
1:10:06
40.
PCA and MDS
-
1:12:35
41.
MDS (Multidimensional Scaling)Principal Coordinate Analysis (PCoA)
-
1:15:11
42.
Correspondence Analysis (CA)
-
1:15:33
43.
QuestionIf you want to check data quality of microarray experiments, which graph will not be used? Scatter plot of PCAHeat mapBox plotVenn diagram
-
1:16:28
44.
Steps for Microarray Experiment
-
1:16:37
45.
Precision vs Accuracy
-
1:20:04
46.
Confusion Matrix (混淆矩陣)
-
1:26:33
47.
Sensitivity vs Specificity
-
1:27:45
48.
Positive Predictive Value (PPV) vs Negative Predictive Value (NPV)
-
1:28:53
49.
Precision (PPV) vs Recall (Sensitivity)
-
1:29:25
50.
Accuracy Paradox
-
1:31:53
51.
F1 Score
-
1:33:23
52.
Alpha vs Beta value
-
1:34:50
53.
Power as a Function of Alpha and Sample Size
-
1:37:32
54.
Sample Size Calculation
-
1:38:41
55.
How to Decide the Cutpoint?
-
1:39:44
56.
Contradiction Between Sensitivity & Specificity
-
1:42:59
57.
Receiver Operating CharacteristicCurve
-
1:45:06
58.
Receiver Operating CharacteristicCurve
-
1:45:41
59.
Summary of Statistics
- 位置
-
- 資料夾名稱
- 2021
- 發表人
- 賴亮全
- 單位
- 賴亮全教授
- 建立
- 2021-03-09 16:21:10
- 最近修訂
- 2021-03-10 13:43:59
- 長度
- 1:47:36